Published on 2025-06-22T04:15:40Z
What is Page Load Time? Examples and Best Practices
Page Load Time is the duration it takes for a web page to fully load and render in a user’s browser. A fast-loading page is essential for delivering a smooth user experience, reducing bounce rates, and boosting engagement. In e-commerce and media sites, even a one-second delay can significantly impact conversions and revenue. Search engines like Google also use page speed as a ranking factor, making load time critical for SEO. Analytics platforms such as PlainSignal and Google Analytics 4 (GA4) automatically capture these metrics, helping you monitor and optimize performance over time.
Page load time
Duration for a web page to fully load; essential for user engagement, SEO, and overall performance.
Definition and Importance of Page Load Time
This section defines Page Load Time and explains its significance in web analytics. We cover how load times influence user satisfaction, engagement metrics, and search engine rankings.
-
Definition
The total time from when a user requests a page (e.g., entering a URL) until all content (HTML, CSS, JavaScript, images) has downloaded and rendered in the browser.
-
Impact on user experience
Faster page load times lead to lower bounce rates, longer session durations, and higher conversion rates. Even a one-second delay can cause significant drops in engagement.
-
Seo and search rankings
Search engines like Google use page speed as a ranking signal. Websites that load faster are more likely to rank higher in search results, improving visibility and traffic.
Key Metrics and Measurement Techniques
Understanding the metrics that comprise Page Load Time is crucial. We differentiate between lab-based synthetic testing and Real User Monitoring (RUM), and highlight the Core Web Vitals that matter most.
-
Real user monitoring (rum) vs synthetic testing
RUM collects performance data from actual users in real-world conditions, offering insights across devices and networks. Synthetic tests simulate page loads in controlled environments, enabling reproducible benchmarks.
-
Real user monitoring
Provides field data reflecting actual visitor experiences across browsers and network conditions.
-
Synthetic testing
Offers consistent, repeatable tests but may not capture all real-world variables.
-
-
Core web vitals
A set of performance metrics defined by Google to quantify user-centric aspects of page speed and interaction readiness.
-
Largest contentful paint (lcp)
Time until the largest visible element is rendered (aim for ≤2.5 s).
-
First input delay (fid)
Delay between a user interaction and browser response (aim for <100 ms).
-
Cumulative layout shift (cls)
Measures visual stability by tracking unexpected layout shifts (aim for <0.1).
-
-
Other performance metrics
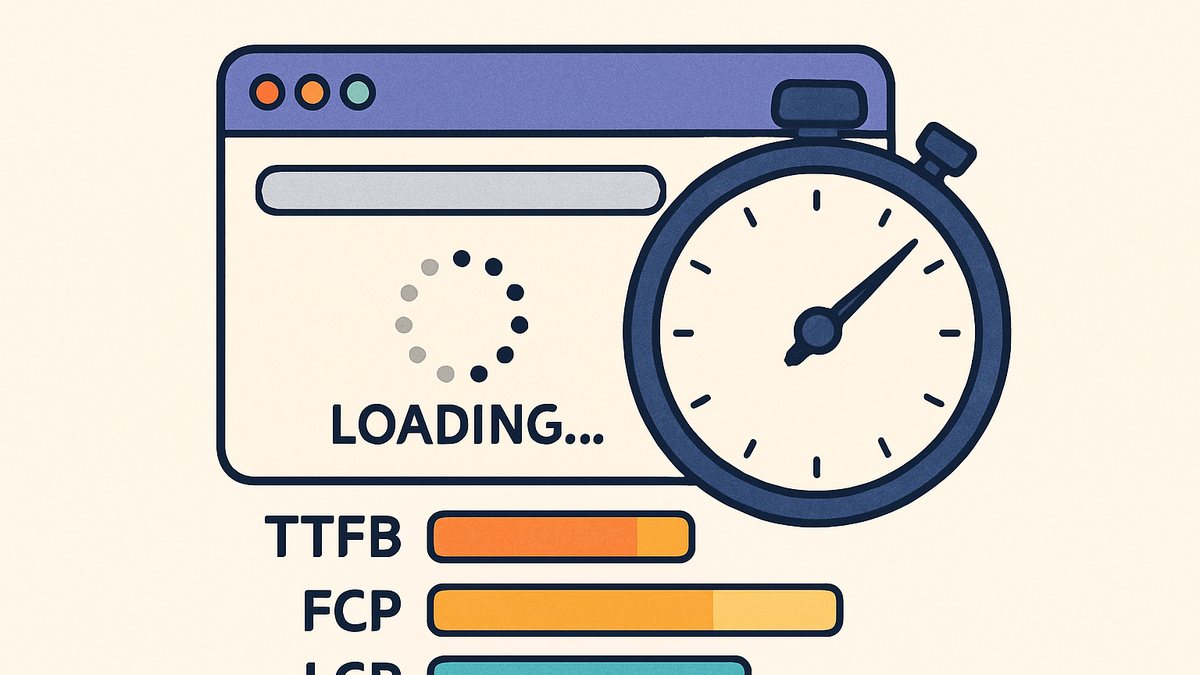
Beyond Core Web Vitals, metrics like Time to First Byte (TTFB), First Contentful Paint (FCP), and DOMContentLoaded time provide additional insights.
-
Time to first byte (ttfb)
Time for the browser to receive the first byte of data from the server.
-
First contentful paint (fcp)
Time until the first text or image is painted on the screen.
-
Dom content loaded
Time when the HTML document has been completely loaded and parsed.
-
Tracking Page Load Time with Analytics Tools
Modern analytics platforms make it easy to capture and visualize page load performance. Below are examples using PlainSignal and Google Analytics 4 (GA4).
-
PlainSignal integration
To collect Page Load Time with PlainSignal, add the following snippet to your site’s
<head>or just before</body>. PlainSignal automatically measures and reports load times without cookies.<link rel="preconnect" href="//eu.plainsignal.com/" crossorigin /> <script defer data-do="yourwebsitedomain.com" data-id="0GQV1xmtzQQ" data-api="//eu.plainsignal.com" src="//cdn.plainsignal.com/plainsignal-min.js"></script>-
Setup
Place the snippet in the
<head>section of your HTML to begin capturing performance metrics. -
Viewing metrics
Log into the PlainSignal dashboard and go to the Performance tab to see real-time Page Load Time data.
-
-
Google analytics 4 (GA4) integration
GA4 can collect site speed metrics out of the box. Add the gtag snippet below and view load times under Engagement > Pages and screens.
<script async src="https://www.googletagmanager.com/gtag/js?id=G-XXXXXXXXXX"></script> <script> window.dataLayer = window.dataLayer || []; function gtag(){dataLayer.push(arguments);} gtag('js', new Date()); gtag('config', 'G-XXXXXXXXXX', { 'anonymize_ip': true }); </script>-
Setup
Replace
G-XXXXXXXXXXwith your GA4 Measurement ID and insert both scripts in your site’s<head>. -
Viewing metrics
In GA4, navigate to Reports → Engagement → Pages and screens to analyze average page load times.
-
Best Practices to Optimize Page Load Time
Improving Page Load Time involves front-end and back-end strategies. Implementing the following practices can significantly reduce load durations and enhance user satisfaction.
-
Minimize http requests
Combine CSS and JavaScript files, use CSS sprites, and remove unused code to reduce the number of server requests.
-
Combine files
Merge multiple CSS/JS into single files to cut down on requests.
-
Remove unused code
Use tools like PurgeCSS to eliminate dead code from your bundles.
-
-
Optimize assets
Compress images with modern formats (e.g., WebP), minify CSS/JS, and lazy-load offscreen content.
-
Image compression
Use tools or CDNs to automatically compress and serve optimized images.
-
Minification
Remove whitespace and comments from CSS/JS to shrink file sizes.
-
Lazy loading
Defer loading of images and iframes until they enter the viewport.
-
-
Leverage browser caching and compression
Configure your server to set cache headers and enable Gzip or Brotli compression for text-based assets.
-
Cache headers
Set appropriate Expires and Cache-Control headers for static resources.
-
Compression
Enable Gzip or Brotli on your web server to reduce transfer sizes.
-
-
Use a content delivery network (cdn)
Serve static assets from servers closer to your users to reduce latency and improve load times.
-
Edge locations
Distribute content across multiple geographic locations for faster delivery.
-
Dynamic content delivery
Choose CDNs that optimize both static and dynamic content requests globally.
-