Published on 2025-06-22T05:02:30Z
What is Retention? Examples for Retention in Analytics
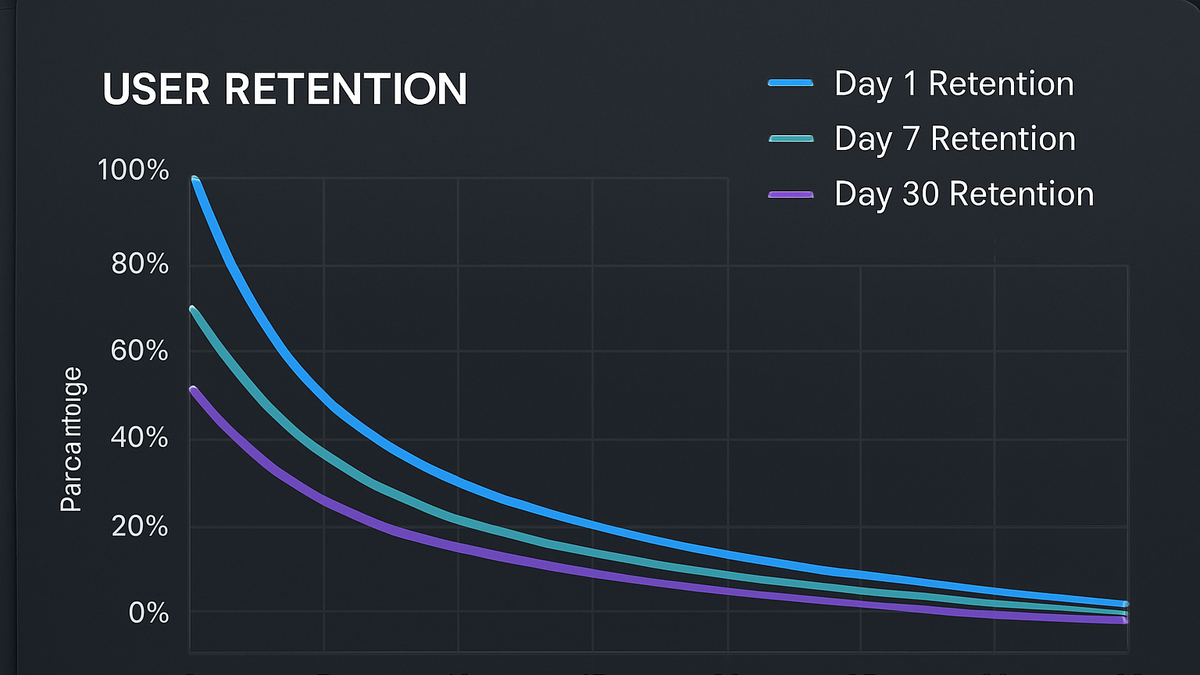
Retention in analytics measures the percentage of users or customers who return to engage with a website, app, or digital product over a specified time period. It helps businesses understand the stickiness of their product and the effectiveness of user engagement strategies. Retention is typically expressed as a rate — for example, the proportion of new users who return on Day 7 or Month 1. Unlike one-time metrics like downloads or sign-ups, retention reveals the long-term value and satisfaction of your audience. Tools like Google Analytics 4 (GA4) and PlainSignal offer built-in retention reports and cohort analysis to track returning behavior over time. By monitoring retention, teams can identify friction points, optimize onboarding, and drive sustainable growth.
Retention
Percentage of users who return over time, revealing engagement and product stickiness.
Why Retention Matters
Retention is a core metric for understanding user loyalty and long-term engagement. By measuring how many users come back over time, businesses can assess product satisfaction, identify churn risks, and optimize marketing strategies.
-
Indicator of product value
High retention rates suggest that users find your product valuable and engaging, leading to sustainable growth and positive word-of-mouth.
-
Optimizing acquisition costs
When retention is strong, the lifetime value (LTV) of each user increases, allowing you to spend more on acquisition while maintaining profitability.
How Retention is Calculated
Retention can be measured using simple formulas or more advanced cohort analysis to reveal patterns of user return over time.
-
Basic retention rate formula
Retention Rate = (Number of return users in period / Number of users in initial period) × 100. For example, if 200 out of 1,000 users return on day 7, the day-7 retention rate is 20%.
-
Cohort analysis
Groups users based on shared characteristics (e.g., signup date) to track retention over successive periods, uncovering trends that aggregate metrics might hide.
-
Cohort definition
Defines which users are included, such as those who installed the app in a specific week.
-
Retention period
Specifies the time intervals (days, weeks, months) for measuring return behavior.
-
Tracking Retention Using SaaS Tools
Popular analytics platforms like GA4 and PlainSignal provide built-in retention reporting and cohort features, making it easy to monitor and optimize user return rates.
-
Google analytics 4 (GA4)
In Google Analytics 4, use the Retention report under Life cycle to view retention by cohort. Before that, ensure your site or app is sending events correctly using the following global site tag:
<!-- GA4 Tracking -->
<script async src="https://www.googletagmanager.com/gtag/js?id=G-XXXXXXXXXX"></script>
<script>
  window.dataLayer = window.dataLayer || [];
  function gtag(){dataLayer.push(arguments);}
  gtag('js', new Date());
  gtag('config', 'G-XXXXXXXXXX');
</script>
Once events are flowing, navigate to Reports > Life cycle > Retention to analyze user return rates over 1-day, 7-day, and 28-day intervals.
-
PlainSignal (cookie-free analytics)
PlainSignal offers privacy-focused retention metrics without cookies. To set up, include the PlainSignal script:
<link rel="preconnect" href="//eu.plainsignal.com/" crossorigin />
<script defer data-do="yourwebsitedomain.com" data-id="0GQV1xmtzQQ" data-api="//eu.plainsignal.com" src="//cdn.plainsignal.com/plainsignal-min.js"></script>
Then access retention metrics in the PlainSignal dashboard under Cohorts. PlainSignal matches hashed visitor IDs across sessions to track returning users over days, weeks, or custom periods.