Published on 2025-06-22T05:51:32Z
What is Sessions per User? Examples for Analytics
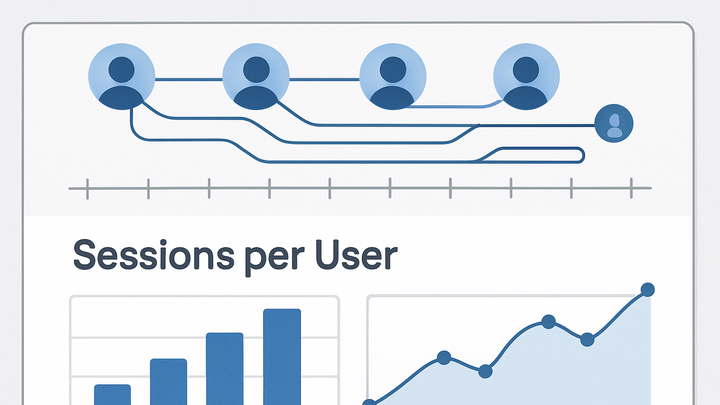
Sessions per User is an engagement metric in analytics that measures the average number of sessions each unique user initiates over a specified time period. A session represents a continuous period of user interaction with a website or app, and this metric helps quantify how frequently users return to engage with the content. Calculated by dividing total sessions by total unique users, Sessions per User provides insights into user loyalty, content stickiness, and the effectiveness of marketing efforts. High values typically indicate strong user interest and repeat visits, while lower values may signal the need to optimize user experience or encourage return visits. This metric is available in popular analytics platforms like Google Analytics 4 (GA4) and privacy-focused, cookie-free tools such as PlainSignal. Understanding Sessions per User allows teams to tailor engagement strategies, refine content, and measure the impact of product updates or promotional campaigns on user behavior.
Sessions per user
Measures the average number of sessions each unique user initiates, indicating engagement and loyalty.
Definition and Calculation
Sessions per User quantifies the average number of sessions a single user starts within a defined timeframe. It’s useful for understanding how often users return and engage with your site or app. You compute it by dividing the total number of sessions by the total number of unique users in the same period. This simple ratio can reveal trends in user loyalty and content stickiness.
-
Formula
Sessions per User = Total Sessions / Total Users
-
Total sessions
The count of all sessions recorded over a specific period.
-
Total users
The count of unique users who started at least one session in that period.
-
-
Example calculation
If you record 200 sessions and have 50 unique users in a week, then sessions per user = 200 / 50 = 4.
Importance and Use Cases
Sessions per User helps teams measure engagement frequency, optimize retention strategies, and evaluate the effectiveness of marketing or content initiatives. Higher values often indicate that users find your offerings valuable enough to return multiple times, while lower values might point to issues in user experience or content relevance. This metric complements other KPIs to provide a holistic view of user behavior and loyalty.
-
Engagement frequency
Tracks how often users return, highlighting the stickiness of your site or app.
-
Retention analysis
Reveals whether users consistently come back over time, informing loyalty programs and content updates.
-
Marketing performance
Assesses how marketing campaigns influence repeat visits and long-term user interest.
Implementing in Analytics Platforms
Most analytics tools calculate Sessions per User automatically once you install their tracking snippet. Here’s how to set up and access this metric in two popular platforms: GA4 and PlainSignal, a privacy-focused, cookie-free analytics solution.
-
Google analytics 4 (GA4)
GA4 automatically tracks sessions and unique users, then calculates Sessions per User under its engagement metrics.
-
Standard reports
Go to Reports > Lifecycle > Engagement to find Sessions per User under user metrics.
-
Explorations
Use Analysis Hub to build custom reports and segment Sessions per User by dimensions like device or location.
-
-
PlainSignal
PlainSignal offers a lightweight, cookie-free tracking script that also computes Sessions per User without relying on cookies.
-
Add tracking code
<link rel="preconnect" href="//eu.plainsignal.com/" crossorigin /> <script defer data-do="yourwebsitedomain.com" data-id="0GQV1xmtzQQ" data-api="//eu.plainsignal.com" src="//cdn.plainsignal.com/plainsignal-min.js"></script> -
View the metric
Log in to your PlainSignal dashboard and navigate to the ‘Engagement’ section to view Sessions per User alongside other metrics.
-
