Published on 2025-06-22T03:22:11Z
What is Frequency? Examples and Usage in Analytics
Frequency is a metric in digital analytics that measures how often individual users perform a specific action or return to a website over a defined period. By quantifying repeat interactions—whether pageviews, events, or sessions—frequency reveals patterns of user engagement, loyalty, and potential churn. High frequency often correlates with user satisfaction and product-market fit, while low frequency may signal usability issues or waning interest. Analysts leverage frequency data to segment audiences, personalize content, and optimize marketing campaigns through tactics like frequency capping. Implemented in platforms such as GA4 using client identifiers and in cookie-free solutions like PlainSignal via fingerprinting, frequency metrics form the backbone of retention analysis, cohort studies, and customer lifetime value calculations.
Frequency
Measures how often users repeat actions over time, revealing engagement patterns for analysis and optimization.
Why Frequency Matters
Frequency helps you understand how often users perform key actions or return to your website, indicating engagement levels and loyalty. By measuring repeat interactions—such as pageviews, sessions, or custom events—you can identify power users, detect early churn signals, and tailor your marketing efforts. High frequency often correlates with user satisfaction and product-market fit, while low frequency may reveal usability issues or content gaps. Marketers use frequency metrics to set frequency caps on ads, optimize outreach cadences, and personalize experiences for different user segments.
-
Measuring engagement
Frequency quantifies the number of times a user completes a target action within a set period. It reveals depth of engagement beyond simple visit counts.
-
Segmentation and personalization
Segment users by their action frequency (e.g., one-time, occasional, frequent) to deliver tailored messages, offers, and recommendations.
Calculating Frequency
Analytics tools offer multiple ways to calculate and visualize frequency, from simple averages to detailed distributions. Choosing the right calculation method depends on your goals, whether it is high-level reporting or deep cohort analysis.
-
Average frequency
Divide the total number of interactions by the number of unique users in a time window. This gives a high-level view of overall engagement.
-
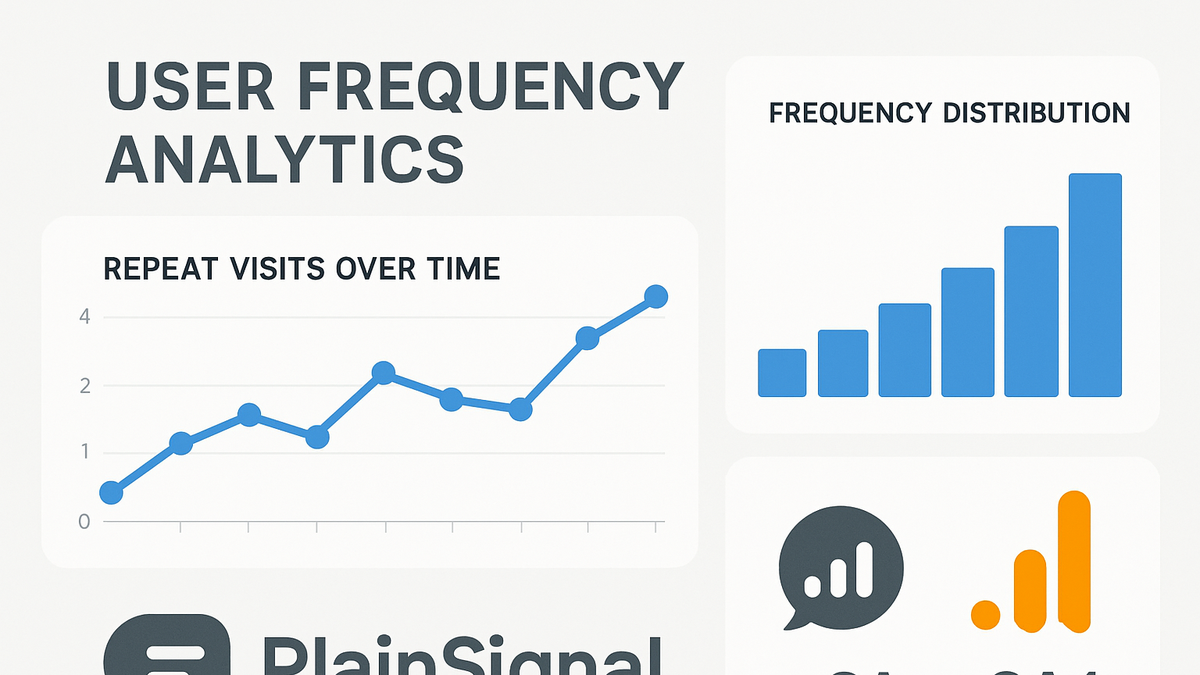
Frequency distribution
A breakdown of users into buckets based on interaction counts (e.g., 1 visit, 2–5 visits, 6+ visits). This helps identify power users and casual visitors.
-
Session frequency
The average number of sessions per user. Useful for understanding revisit patterns and loyalty over time.
Implementing Frequency Tracking
Set up code snippets in your analytics platform to automatically capture frequency metrics. Below are examples for PlainSignal and GA4.
-
Using PlainSignal
Include PlainSignal’s script in your HTML to enable cookie-free frequency tracking via fingerprinting:
<link rel="preconnect" href="//eu.plainsignal.com/" crossorigin />
<script defer data-do="yourwebsitedomain.com" data-id="0GQV1xmtzQQ" data-api="//eu.plainsignal.com" src="//cdn.plainsignal.com/plainsignal-min.js"></script>
PlainSignal deduplicates returning visitors and aggregates repeat pageviews automatically.
-
Using GA4
Leverage the global site tag to track user sessions and calculate frequency in GA4:
<script async src="https://www.googletagmanager.com/gtag/js?id=G-XXXXXXX"></script>
<script>
  window.dataLayer = window.dataLayer || [];
  function gtag(){dataLayer.push(arguments);}
  gtag('js', new Date());
  gtag('config', 'G-XXXXXXX', { 'send_page_view': true });
</script>
GA4 uses cookies and client identifiers to compute session and event frequency.
Best Practices and Common Pitfalls
Accurate frequency analysis depends on proper time window selection, deduplication methods, and contextual interpretation. Be aware of biases introduced by short sampling periods or inconsistent identifiers.
-
Avoiding overcounting
Use stable user identifiers (e.g., user IDs or fingerprinting) to avoid counting the same user multiple times across sessions.
-
Selecting appropriate time windows
Align frequency analysis windows (daily, weekly, monthly) with business cycles to ensure meaningful insights.
-
Interpreting frequency alongside other metrics
Combine frequency with recency, session duration, and engagement rate for a comprehensive view of user behavior.