Published on 2025-06-26T04:40:19Z
What is Recency? Definitions and Examples in Analytics
Recency is a metric that measures the time elapsed since a user’s last interaction with your website or application. It’s a core component of RFM analysis (Recency, Frequency, Monetary) and provides vital insights into user engagement levels. By tracking recency, marketing and product teams can identify active, dormant, or churn-risk users and tailor re-engagement strategies accordingly. This metric helps optimize marketing spend, improve personalization, and enhance user retention by focusing efforts on users based on their most recent activity date. Recency is supported across a wide range of analytics tools, from privacy-focused platforms like PlainSignal to comprehensive suites such as Google Analytics 4 (GA4).
Recency
Recency measures the time since a user's last interaction, helping segment engagement and guide re-engagement strategies.
Why Does Recency Matter?
Recency indicates how recently a user has engaged with your product, serving as a leading indicator of interest and potential conversion. It helps prioritize marketing and support efforts by distinguishing active users from those at risk of churn. Lower recency (recent activity) often correlates with higher engagement and purchase likelihood, while higher recency signals disengagement. Understanding recency patterns enables teams to design timely interventions—such as targeted email campaigns or in-app messages. Focusing on current user behavior optimizes resource allocation and maximizes return on investment in marketing initiatives.
-
User engagement indicator
A low recency value (fewer days since last visit) signals that users are actively engaging with your site or app, indicating strong interest and potential for conversions.
-
Targeted re-engagement
Segment users based on recency to craft personalized campaigns—such as reminder emails or special offers—to encourage return visits from dormant users.
How Recency Is Calculated
Recency is typically calculated by subtracting the timestamp of the user’s most recent session or key event from the current timestamp. The result can be expressed in days, hours, or minutes depending on your analysis needs. Accurate calculation requires consistent timestamp formats and consideration of data processing delays. For strategic segmentation, recency values are often grouped into buckets that reflect meaningful user lifecycle stages. This structured approach simplifies reporting and aligns segments with business objectives.
-
Raw timestamp difference
Compute recency by taking the difference between the last event timestamp and the current time, providing a precise measure of elapsed time.
-
Time zone consistency
Ensure all timestamps are normalized to a single time zone to prevent inaccuracies in recency calculations across global user bases.
-
Data processing latency
Account for ingestion delays that may affect real-time recency accuracy, especially in systems with batch data processing.
-
-
Bucketed recency segments
Group recency values into defined ranges (e.g., 0–7 days, 8–30 days, >30 days) to simplify segment analysis and targeting.
-
Define lifecycle stages
Choose buckets that mirror your customer journey—such as new, active, dormant, and at-risk—to inform appropriate engagement strategies.
-
Dynamic adjustments
Regularly review and adjust bucket thresholds in response to shifting user behavior or campaign outcomes.
-
Recency in Analytics Tools
Different analytics platforms offer built-in support for recency tracking, each with its own implementation. Below are examples using two popular tools: PlainSignal, a cookie-free analytics solution, and Google Analytics 4 (GA4), a comprehensive analytics suite.
-
PlainSignal (cookie-free analytics)
PlainSignal provides recency out of the box in a privacy-centric manner. Install the tracking script using:
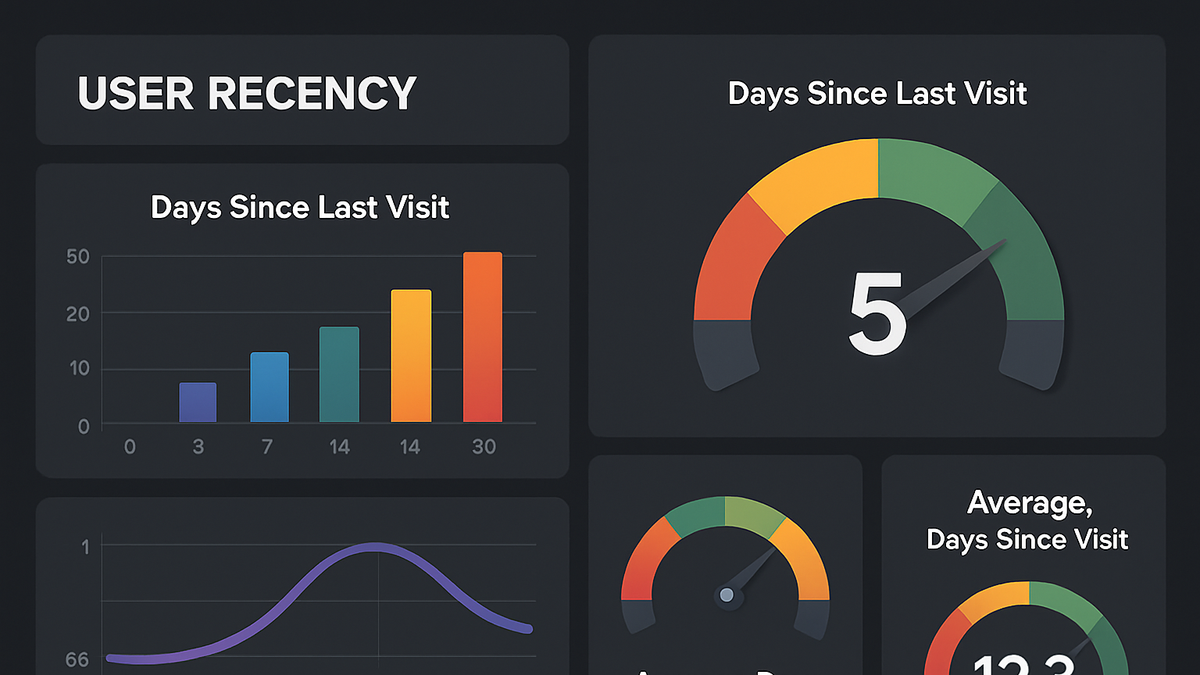
<link rel="preconnect" href="//eu.plainsignal.com/" crossorigin />
<script defer data-do="yourwebsitedomain.com" data-id="0GQV1xmtzQQ" data-api="//eu.plainsignal.com" src="//cdn.plainsignal.com/plainsignal-min.js"></script>
Once integrated, the dashboard automatically displays “Days Since Last Visit” for each visitor, enabling segmentation without relying on cookies.
-
Google analytics 4 (GA4)
In GA4, recency is captured via the “Days Since Last Session” dimension. To analyze it:
- Navigate to Explore > Free form report.
- Add Days Since Last Session as a dimension.
- Build segments or visualizations based on recency buckets.
For deeper analysis, export GA4 data to BigQuery and write SQL queries to calculate and segment recency values.
Best Practices for Using Recency
Applying recency metrics effectively requires thoughtful integration with other data points and alignment with your user lifecycle. Follow these best practices to maximize the impact of recency insights on engagement and retention strategies.
-
Combine with frequency and monetary metrics
Use recency alongside frequency and monetary metrics to build robust RFM models, enabling nuanced user segmentation and prioritization.
-
Set appropriate recency windows
Define recency thresholds that match your product’s usage patterns—such as daily windows for news sites or monthly windows for enterprise software—to ensure segments reflect meaningful behavior.
-
Monitor recency trends
Track changes in average recency over time to spot engagement shifts, assess campaign impacts, and identify potential churn signals before they escalate.