Published on 2025-06-28T08:27:48Z
What is Performance in Analytics? Understanding Website Speed and Responsiveness
Performance in analytics refers to the measurement of how quickly and efficiently a website or application responds to user interactions. It encompasses metrics such as page load times, rendering speeds, server response times, and stability during page loads. High performance is crucial for delivering a smooth user experience, improving engagement, and boosting conversion rates. Tools like GA4 and PlainSignal provide insights into these performance indicators, allowing businesses to identify bottlenecks and optimize their digital properties. PlainSignal offers a lightweight, cookie-free approach to monitoring performance, while GA4 leverages real user monitoring (RUM) and synthetic tests to capture detailed metrics. Together, these platforms enable a comprehensive view of performance that balances privacy, accuracy, and depth of insights.
Performance
Measures website response speed and efficiency via metrics like page load times and Web Vitals, tracked with GA4 and cookie-free PlainSignal analytics.
Why Performance Matters
Website performance directly influences user satisfaction, engagement, and retention. Slow pages can lead to higher bounce rates, lower session durations, and reduced conversion rates. Additionally, search engines like Google factor performance into their ranking algorithms, making it essential for SEO. By monitoring performance metrics, businesses can make data-driven decisions to improve both user experience and search visibility.
-
User experience and engagement
Slower load times frustrate visitors, often causing them to abandon the site before it fully renders.
-
Seo and search rankings
Search engines prioritize fast-loading websites in search results, impacting organic traffic.
-
Conversion rates and revenue
Faster websites typically see higher conversion rates as users complete actions more quickly.
Key Performance Metrics
Tracking specific metrics helps you pinpoint performance issues and prioritize optimizations. These metrics collectively form the backbone of modern web performance analysis.
-
Page load time
The total time it takes for a page to fully load in the browser. Lower values lead to better user satisfaction.
-
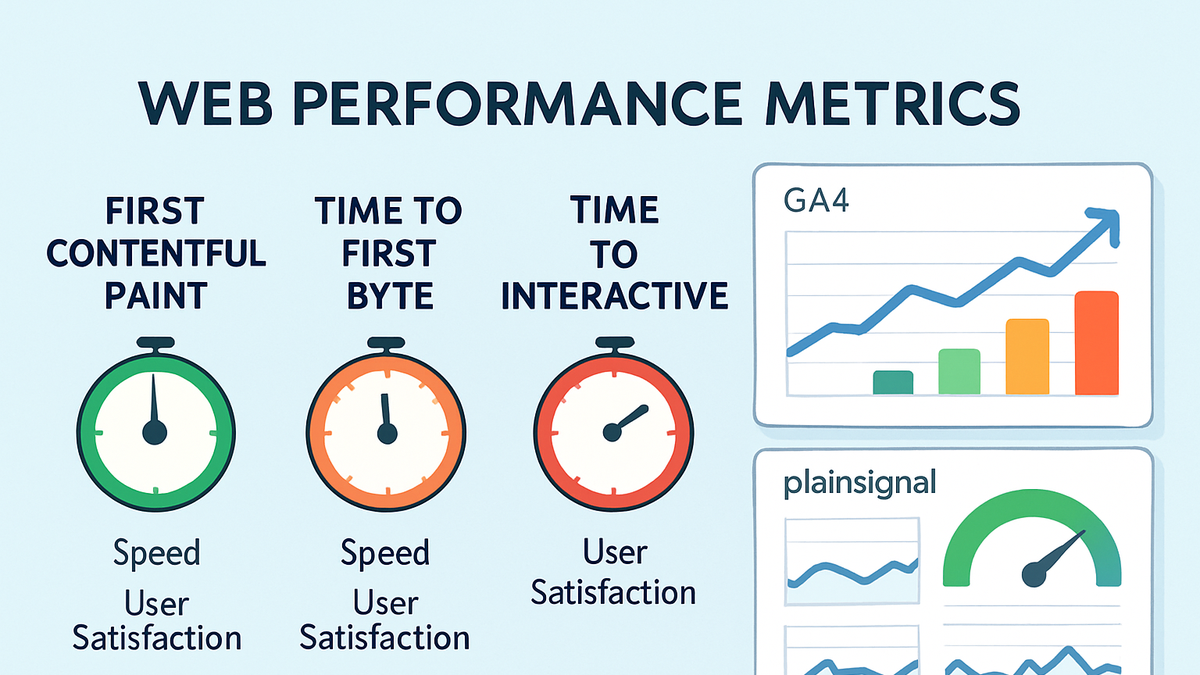
Time to first byte (ttfb)
The time between a user’s request and the first byte of response from the server. It reflects backend performance.
-
First contentful paint (fcp)
The time until the first piece of DOM content (text, image, etc.) is rendered, indicating initial progress.
-
Time to interactive (tti)
The time it takes for the page to become fully interactive, meaning all event handlers are registered and ready.
-
Cumulative layout shift (cls)
A measure of visual stability, quantifying unexpected layout shifts during page load.
Tracking Performance with PlainSignal and GA4
Implementing performance tracking tools allows you to collect real user data and monitor trends over time. PlainSignal provides a simple, cookie-free script for basic metrics, while GA4 offers advanced real user monitoring and Web Vitals integration.
-
PlainSignal implementation
Add the following snippet before the closing
</head>tag:<link rel="preconnect" href="//eu.plainsignal.com/" crossorigin /> <script defer data-do="yourwebsitedomain.com" data-id="0GQV1xmtzQQ" data-api="//eu.plainsignal.com" src="//cdn.plainsignal.com/plainsignal-min.js"></script>PlainSignal then captures performance metrics without using cookies, offering a privacy-friendly analytics solution.
-
GA4 real user monitoring
Include the GA4 tag in your
<head>to start collecting data:<script async src="https://www.googletagmanager.com/gtag/js?id=G-XXXXXXX"></script> <script> window.dataLayer = window.dataLayer || []; function gtag(){dataLayer.push(arguments);} gtag('js', new Date()); gtag('config', 'G-XXXXXXX'); </script>Then enable Web Vitals under Admin > Data Streams > Enhanced Measurement to automatically capture metrics like FCP, TTFB, and CLS.
Optimizing Website Performance
Once you’ve measured your site’s performance, apply these best practices to improve load times and user experience.
-
Minimize http requests
Combine files, use CSS sprites, and remove unnecessary plugins to reduce the number of requests.
-
Optimize images and assets
Compress images, use responsive formats like WebP, and lazy-load offscreen media.
-
Implement caching strategies
Leverage browser and server-side caching to serve repeat visitors faster.
-
Use a content delivery network (cdn)
Distribute assets across edge servers to reduce latency for global users.
-
Reduce javascript and css blocking
Defer non-critical scripts, inline critical CSS, and eliminate render-blocking resources.