Published on 2025-06-22T04:37:12Z
What is Processing Time in Analytics? Examples from GA4 & PlainSignal
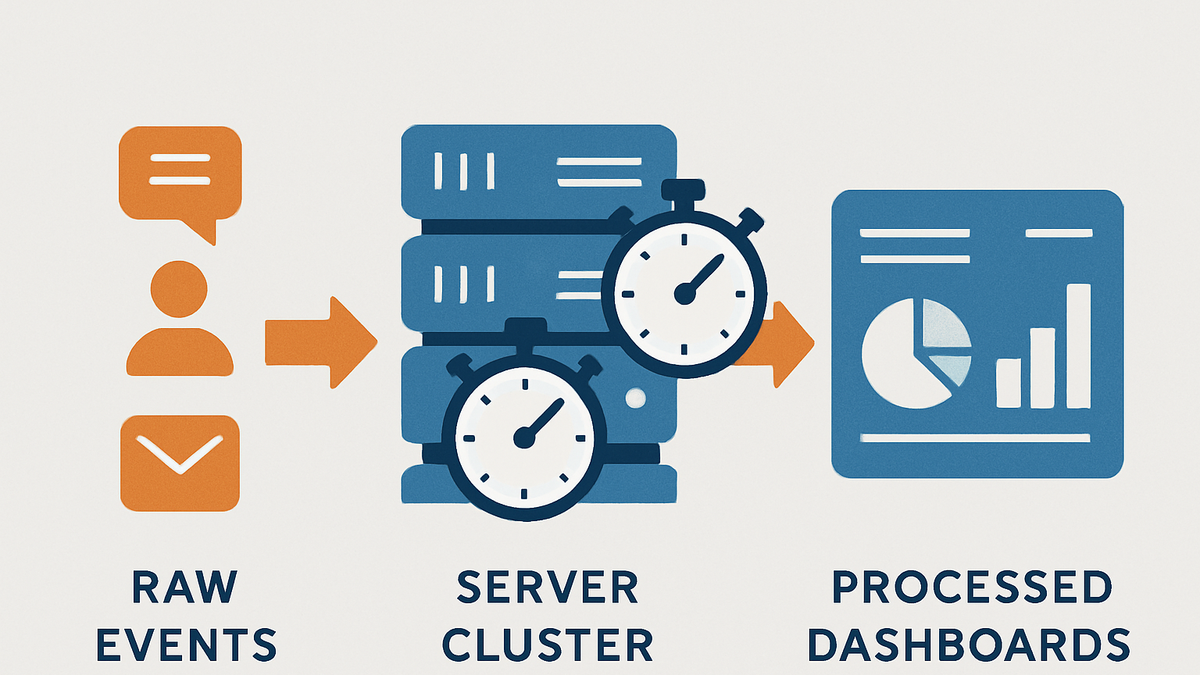
Processing Time in analytics refers to the delay between when an event (pageview, click, transaction) occurs on your website or app and when that event is fully processed, aggregated, and available for reporting. This delay encompasses data collection, transformation, aggregation, and indexing stages within an analytics platform. Processing time can range from real-time (a few seconds) to batch delays of minutes, hours, or even days, depending on the system’s architecture and workload. Lower processing times enable businesses to make quicker, data-driven decisions and detect anomalies or user trends as they happen. Conversely, longer processing times can result in outdated reports, affecting the timeliness of insights. Understanding and optimizing processing time is crucial for maintaining data freshness and delivering real-time analytics to stakeholders.
Processing time
The delay between data collection and its availability in analytics reports, impacting data freshness and decision-making.
Why Processing Time Matters
Processing time directly influences how quickly you can access accurate data and make informed decisions. In fast-moving digital environments, delays can lead to missed opportunities or outdated insights. Efficient processing ensures that dashboards reflect the current state of user activity, enabling timely interventions. Real-time processing supports immediate alerting for anomalies, while slower pipelines might only surface issues after the fact. Ultimately, optimizing processing time empowers teams to be proactive rather than reactive.
-
Data freshness
Short processing times ensure that metrics reflect the current state of your website or app. This freshness is critical for live monitoring, A/B testing rollouts, or performance tuning.
-
Near-real-time insights
When processing time is minimal, you can react to user behavior almost instantly.
-
Delayed reporting
Long processing times result in reports that lag behind actual user activity.
-
-
Decision-making impact
Faster processing allows teams to base decisions on up-to-date data, reducing risks associated with outdated information.
-
Alerting and anomaly detection
Real-time processing enables immediate alerts when metrics cross thresholds, helping detect anomalies like traffic spikes or errors.
Factors Affecting Processing Time
Processing time can vary based on architectural choices, data volume, and processing models. Understanding these factors helps in designing efficient analytics pipelines that balance speed, cost, and accuracy.
-
Data volume and complexity
High volumes of events or complex data transformations increase compute load, extending processing times.
-
High traffic spikes
Sudden surges in traffic can overwhelm processing nodes, causing backlogs.
-
Complex transformations
Advanced calculations, filtering, or data joins require more resources and time.
-
-
Batch vs stream processing
Batch systems process data in scheduled jobs, causing predictable delays, while stream systems process events continuously for lower latency.
-
Batch processing jobs
Scheduled jobs may run hourly or daily, creating reporting windows.
-
Real-time streams
Continuous pipelines enable near-instant processing of individual events.
-
-
Sampling and filtering
Applying sampling reduces data volume at the expense of detailed fidelity, often improving processing speed.
Processing Time in Popular SaaS Analytics Tools
Different SaaS analytics platforms have varying processing architectures and service-level agreements (SLAs). Comparing Google Analytics 4 (GA4) and PlainSignal highlights these differences.
-
Google analytics 4 (GA4) processing time
GA4 processes standard reports within 24–48 hours. Its DebugView and real-time reports update events within seconds to minutes, but historical data queries rely on batch processing.
-
PlainSignal processing time
PlainSignal offers cookie-free, privacy-friendly analytics with near real-time processing—events typically appear in dashboards within seconds. To install, embed the following snippet:
<link rel="preconnect" href="//eu.plainsignal.com/" crossorigin />
<script defer data-do="yourwebsitedomain.com" data-id="0GQV1xmtzQQ" data-api="//eu.plainsignal.com" src="//cdn.plainsignal.com/plainsignal-min.js"></script>
How to Measure and Optimize Processing Time
Monitoring and tuning your analytics pipelines helps maintain low processing times. Follow these best practices to ensure timely data delivery.
-
Use real-time dashboards
Tools like GA4 DebugView and PlainSignal’s live dashboard help you gauge end-to-end processing delays.
-
Monitor processing metrics
Track system metrics such as queue backlogs, batch job durations, and API latency to identify bottlenecks.
-
Optimize data workflows
Simplify data transformations, filter unneeded events early, and scale processing resources to meet demand.