Published on 2025-06-22T09:08:44Z
What is Purchase Frequency? Definition & Examples
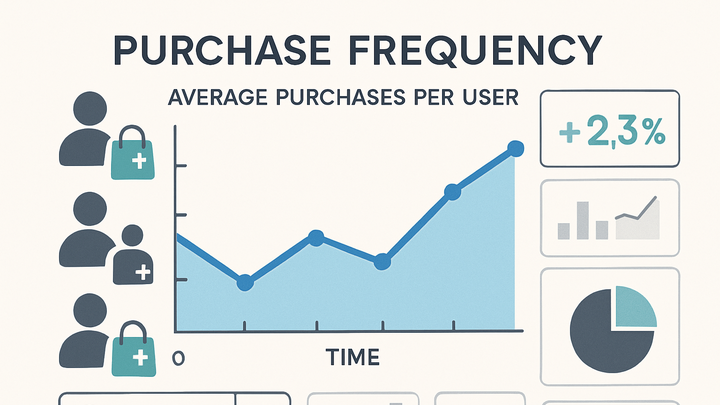
Purchase Frequency is the metric that measures how often customers make purchases within a defined period. In analytics, it’s crucial for e-commerce and subscription businesses to understand buying patterns. A higher purchase frequency indicates strong customer engagement and loyalty, while a lower frequency may signal churn risk. This metric can help you forecast revenue, optimize marketing strategies, and segment customers based on their buying behavior. Tools like plainSignal and Google Analytics 4 (GA4) allow you to track purchase events, calculate purchase frequency, and visualize trends. By analyzing purchase frequency alongside other metrics like Average Order Value (AOV) and Customer Lifetime Value (CLV), businesses can craft targeted campaigns, improve retention, and drive sustainable growth.
Purchase frequency
Average number of purchases per customer over a period, used to gauge customer engagement and predict revenue.
Definition of Purchase Frequency
This section defines Purchase Frequency within analytics, covering its conceptual meaning, components, and standard formula.
-
Core definition
Purchase Frequency is the average number of purchases made by a customer within a specific time frame.
-
Time period selection
The chosen time window—such as 30 days, 90 days, or one year—impacts how the metric reflects customer behavior.
-
Short vs. long windows
Short windows capture recent buying patterns, while longer windows reveal overall engagement trends.
-
-
Standard formula
Calculated as: Total Number of Orders ÷ Total Number of Unique Customers during the selected period.
Why Purchase Frequency Matters
Understanding Purchase Frequency is key to measuring customer loyalty, forecasting growth, and optimizing marketing efforts.
-
Indicator of engagement
Higher frequency signals active and satisfied customers, while declines may indicate churn risk.
-
Revenue forecasting
Estimating repeat purchase rates helps project future sales and inform inventory planning.
-
Marketing segmentation
Segment customers by purchase frequency to tailor loyalty programs, promotions, and re-engagement campaigns.
Calculating Purchase Frequency in Analytics Tools
Step-by-step guidance to implement and calculate Purchase Frequency using plainSignal and GA4.
-
PlainSignal (cookie-free analytics)
Set up purchase event tracking and calculate frequency directly in plainSignal’s dashboard. Example tracking code:
-
Tracking code
<link rel="preconnect" href="//eu.plainsignal.com/" crossorigin /> <script defer data-do="yourwebsitedomain.com" data-id="0GQV1xmtzQQ" data-api="//eu.plainsignal.com" src="//cdn.plainsignal.com/plainsignal-min.js"></script> -
Dashboard calculation
In plainSignal’s Events report, filter for your purchase event and divide total purchase count by unique users.
-
-
Google analytics 4 (GA4)
Configure and track the standard ‘purchase’ event, then calculate frequency using GA4 reports or Explorations.
-
GA4 setup
Enable e-commerce tracking in GA4 settings and confirm ‘purchase’ events fire correctly.
-
Using explorations
Create a free-form Exploration with metrics ‘Event count’ (purchase) and ‘Active users’, then apply a custom formula to divide them.
-
Best Practices & Considerations
Guidelines to ensure accurate tracking and insightful interpretation of Purchase Frequency data.
-
Choose appropriate timeframes
Align analysis periods with sales cycles (e.g., weekly, monthly, quarterly) to maintain relevance.
-
Segment your audience
Analyze frequency by customer cohorts, acquisition channels, or demographics for targeted insights.
-
Combine with complementary metrics
Look at Purchase Frequency alongside AOV and CLV to contextualize buying behavior and profitability.
-
Ensure data quality
Validate event accuracy, filter out test or bot traffic, and regularly audit your analytics setup.
