Published on 2025-06-27T19:59:57Z
What are Weekly Active Users (WAU)? Examples & Tracking
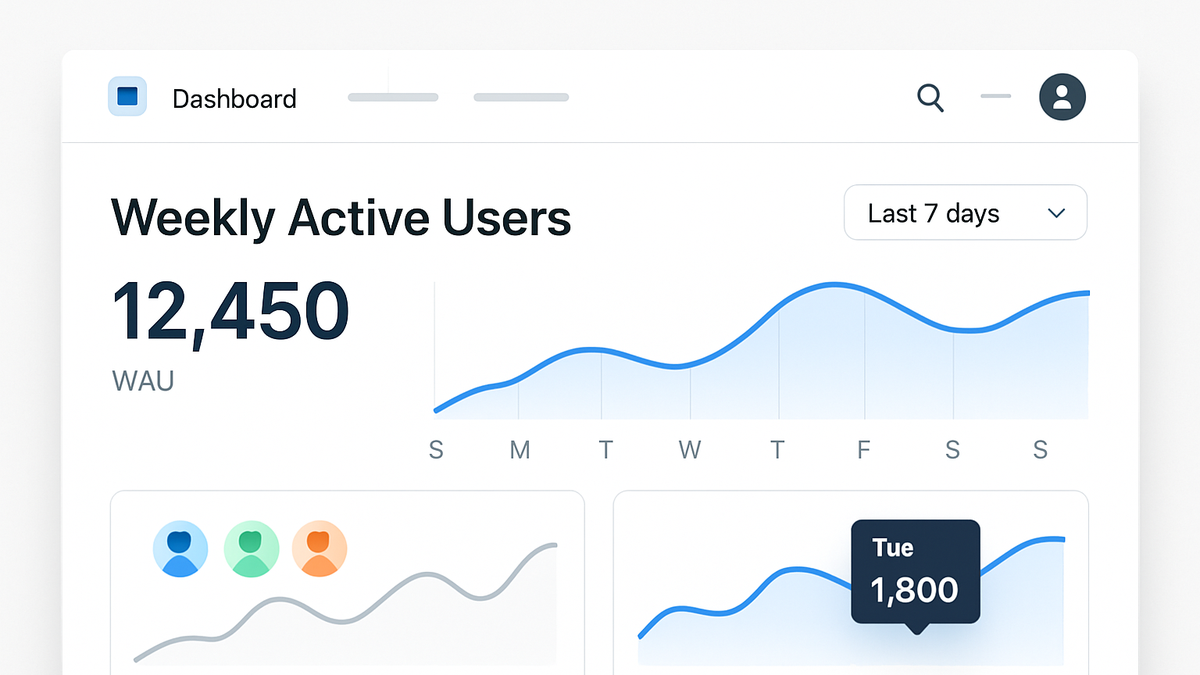
Weekly Active Users (WAU) is a metric that counts the number of unique users who engage with a product or service within a seven-day period. It sits between Daily Active Users (DAU) and Monthly Active Users (MAU) as a mid-term engagement indicator, offering a balance between short-term and long-term usage patterns. Tracking WAU helps teams understand user loyalty, measure product stickiness, and detect early trends in engagement before they show up in monthly metrics. WAU can be implemented with modern analytics tools like Google Analytics 4 (GA4) or privacy-first solutions like PlainSignal. By analyzing WAU alongside other KPIs, product managers and marketers can make data-driven decisions to improve retention, refine features, and optimize marketing campaigns. Monitoring WAU over time also aids in forecasting growth and resource planning.
Weekly active users (wau)
WAU measures unique users active over a week, revealing mid-term engagement and guiding retention strategies.
Why Weekly Active Users (WAU) Matters
WAU offers a balanced view of user engagement, smoothing out daily fluctuations while providing more timely insights than monthly metrics. It helps teams:
- Detect weekly trends and patterns
- Identify early signs of feature adoption or drop-off
- Benchmark engagement against industry standards
-
Smoothing daily volatility
Daily Active Users can swing widely due to daily events or campaigns. WAU averages these spikes over seven days to reveal true engagement.
-
Detecting early trends
Since WAU updates more frequently than MAU, it highlights shifts in usage patterns sooner, enabling quicker responses to user behavior changes.
Calculating Weekly Active Users
WAU is calculated by counting each unique user who performs at least one meaningful action (e.g., login, page view, purchase) during a rolling seven-day window. The key steps are:
-
Standard calculation method
Aggregate unique user IDs over the past seven days. Avoid double-counting by deduplicating IDs per week window.
-
Using google analytics 4 (GA4)
GA4 provides a built-in WAU metric under “Active users by week.” You can segment this metric by dimensions like user type or acquisition channel.
-
Using PlainSignal
PlainSignal offers cookie-free analytics that can track WAU without storing personal identifiers. To set up, add the tracking snippet to your site:
-
Tracking code example
<link rel="preconnect" href="//eu.plainsignal.com/" crossorigin />
<script defer data-do="yourwebsitedomain.com" data-id="0GQV1xmtzQQ" data-api="//eu.plainsignal.com" src="//cdn.plainsignal.com/plainsignal-min.js"></script>
-
Best Practices for WAU Analysis
Accurate WAU insights depend on clean data collection, consistent definitions, and regular monitoring. Follow these best practices:
-
Define meaningful user actions
Choose events that signify true engagement (e.g., content creation, purchases) rather than trivial interactions like page reloads.
-
Maintain consistent user ids
Ensure your analytics tool reliably identifies users across devices and sessions to prevent under- or over-counting.
-
Segment and compare cohorts
Break down WAU by user cohorts (e.g., acquisition channel, geography) to uncover targeted engagement patterns.
Real-World Applications of WAU
Teams across product, marketing, and leadership rely on WAU to drive strategic decisions. Common applications include:
-
Feature launch evaluation
Measure the impact of new features by comparing WAU before and after release to assess adoption.
-
Marketing campaign effectiveness
Track changes in WAU attributable to campaign efforts, helping optimize budgets and messaging.
-
Retention and churn analysis
Monitor WAU trends over time to detect early signs of user attrition and implement retention strategies promptly.