Published on 2025-06-27T22:47:26Z
What is a Data Pipeline? Examples for Analytics
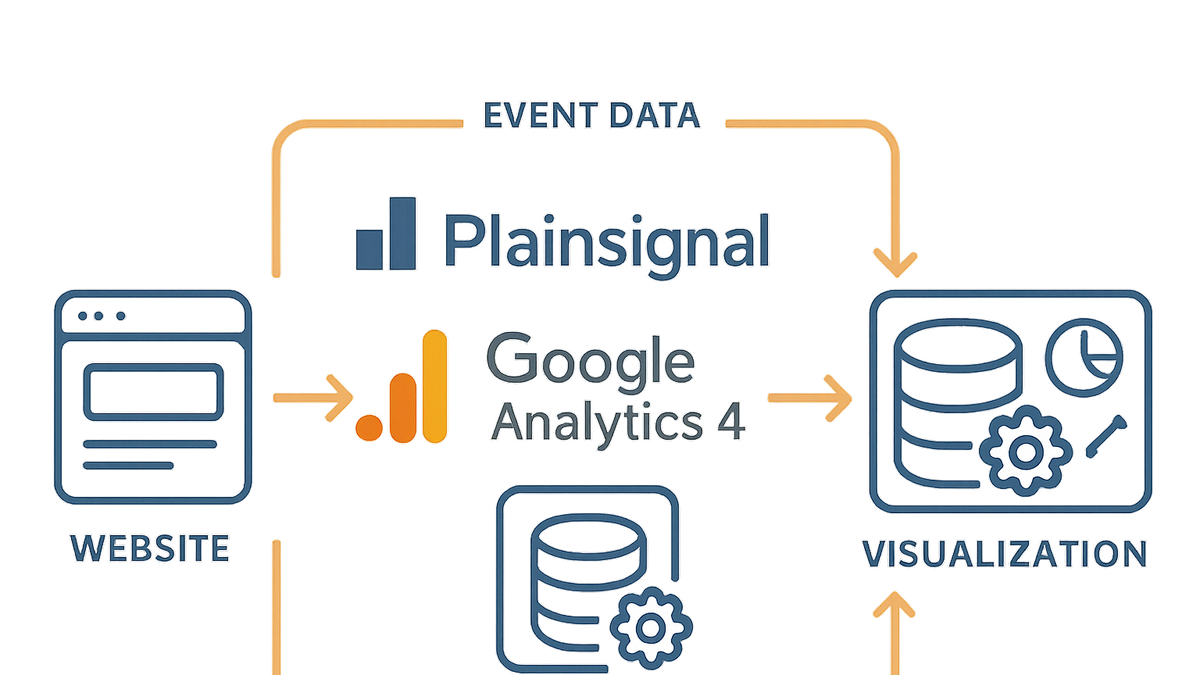
A data pipeline is a series of processes and tools that move raw data from one or more sources to target systems, where it can be analyzed. In analytics, pipelines handle the end-to-end flow of event data—from capture in tracking scripts to transformation, storage, and visualization.
Data pipelines automate repetitive tasks such as data cleansing and aggregation, enforce consistent schemas, and provide reliable pathways for delivering metrics to dashboards. They form the backbone of modern analytics by ensuring data is accurate, timely, and accessible to stakeholders.
Data pipelines
A data pipeline automates collection, processing, and delivery of analytics data from source to dashboard.
Definition and Overview
Data pipelines in analytics connect data sources to insights by automating ingestion, transformation, storage, and visualization. They ensure data flows smoothly from capture points—like JavaScript tracking snippets—to dashboards in tools such as PlainSignal and GA4.
-
Data ingestion
The stage where raw event data is collected from websites, apps, or servers. Tools like PlainSignal and GA4 rely on embedded scripts to capture user interactions in real time through APIs and tracking snippets.
-
Data transformation
Raw events are cleaned, enriched, and formatted. Processes may involve filtering unwanted data, mapping fields to a common schema, aggregating metrics, and applying business logic.
-
Data storage
Processed data is loaded into repositories optimized for analytics, such as GA4’s internal tables or external data warehouses. This stage should support fast queries and data retrieval for reporting.
-
Data analysis & visualization
Stored data is accessed by analytics interfaces to build dashboards, reports, and ad hoc queries. Visualization layers help stakeholders derive insights from processed metrics.
Types of Data Pipelines
Analytics pipelines generally follow either batch or streaming patterns, depending on latency requirements and data volumes.
-
Batch pipelines
Operate at scheduled intervals. Data is collected over defined windows (e.g., hourly or daily), processed in bulk, and then loaded for analysis. Ideal for routine reporting.
-
Streaming pipelines
Process data continuously as events occur. They deliver near real-time analytics, enabling rapid insights and alerts. PlainSignal’s cookie-free tracking and GA4’s real-time reports are examples of this approach.
Example: Implementing a Website Analytics Pipeline
This example demonstrates a simple web analytics pipeline using PlainSignal for cookie-free event collection and GA4 for additional insights.
-
PlainSignal tracking setup
Place the following snippet in the
<head>of your pages to enable PlainSignal event tracking.-
Code example
<link rel="preconnect" href="//eu.plainsignal.com/" crossorigin />
<script defer data-do="yourwebsitedomain.com" data-id="0GQV1xmtzQQ" data-api="//eu.plainsignal.com" src="//cdn.plainsignal.com/plainsignal-min.js"></script>
-
-
GA4 tracking setup
Add the global site tag (
gtag.js) to initialize Google Analytics 4 on your site.-
Code example
<!-- Global site tag (gtag.js) - Google Analytics -->
<script async src="https://www.googletagmanager.com/gtag/js?id=GA_MEASUREMENT_ID"></script>
<script>
  window.dataLayer = window.dataLayer || [];
  function gtag(){dataLayer.push(arguments);}
  gtag('js', new Date());
  gtag('config', 'GA_MEASUREMENT_ID');
</script>
-
-
Data flow
Once the snippets are in place, events flow directly from the browser to PlainSignal’s servers for immediate processing and to GA4’s backend for aggregated reporting. Data can then be visualized in each tool’s dashboard or exported for further analysis.
Best Practices for Data Pipelines
Follow these best practices to build reliable, scalable, and maintainable analytics pipelines.
-
Monitoring and alerting
Set up health checks and alerts for dropped events, data delays, or schema mismatches. Use built-in dashboards and APIs from PlainSignal and GA4 to track pipeline performance.
-
Data validation
Implement schema enforcement at ingestion to catch malformed data early. Use data contracts or versioned schemas to manage changes without breaking downstream processes.
-
Scalability & maintenance
Design pipelines to handle increasing event volumes by using managed or serverless services that auto-scale. Regularly review transformations and clean up unused fields to optimize performance.