Published on 2025-06-22T01:49:38Z
What is Application Analytics? Examples and Best Practices
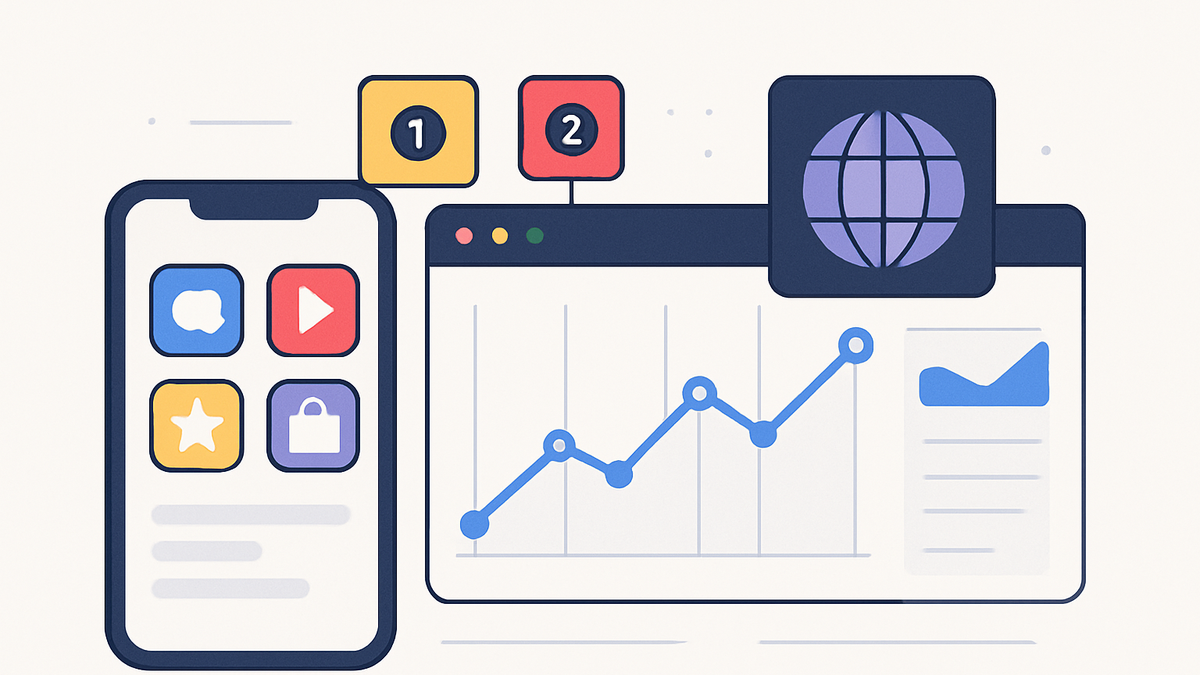
Application Analytics refers to the process of collecting, analyzing, and interpreting data generated by users interacting with web and mobile applications. It goes beyond traditional pageview metrics to capture in-app events, user flows, performance metrics, and crash reports. By tracking actions like button taps, screen views, and form submissions, teams can understand how users engage with features and where they encounter friction. Tools like PlainSignal and Google Analytics 4 (GA4) use SDK-based integrations to streamline data collection and visualization. PlainSignal provides a lightweight, cookie-free analytics solution for privacy-conscious applications, while GA4 enables advanced event modeling and cross-platform insights. Implementation typically involves installing an SDK, defining custom events, and configuring dashboards to monitor key metrics. Armed with application analytics, product managers and developers can make data-driven decisions to optimize user experiences, improve retention, and drive product growth.
Application analytics
Application Analytics captures in-app events, performance, and user engagement to guide product optimization and growth.
Why Application Analytics Matters
Application Analytics provides critical insights into how users interact with applications and pinpoints areas for improvement. It helps teams identify performance bottlenecks, measure user satisfaction, and prioritize feature developments based on real usage data.
-
Performance monitoring
Track app load times, API response rates, and resource usage to ensure smooth user experiences and quickly address performance issues.
-
User behavior insights
Understand how users navigate through your app, which features they use most, and where they drop off to inform UX and product decisions.
-
Retention and growth
Measure retention curves, analyze user cohorts, and calculate lifetime value to drive strategies that increase user engagement and growth.
Key Metrics in Application Analytics
Key metrics offer quantitative benchmarks that teams use to evaluate app performance and user engagement. Monitoring these metrics over time reveals trends and impacts of product changes.
-
Active users
The number of unique users engaging with the app over a specific period, such as daily (DAU) or monthly (MAU).
-
Daily active users (dau)
Count of unique users who open and interact with the app within a 24-hour period.
-
Monthly active users (mau)
Count of unique users who engage with the app at least once within a 30-day window.
-
-
Session length
Average duration of a user session, indicating how long users stay engaged during each visit.
-
Crash rate
Percentage of sessions that end due to application crashes, a key indicator of app stability.
-
Crash-free users
Percentage of users who have not experienced any crashes during their sessions.
-
-
Retention rate
Percentage of users who return to the app after their first visit, an indicator of ongoing engagement.
Implementing Application Analytics
Setting up application analytics involves integrating SDKs, defining events, and configuring dashboards and alerts to make data actionable.
-
Integrate the sdk
Install and configure the analytics SDK in your application codebase to start capturing data.
-
PlainSignal integration
Add the following snippet to your HTML or app entry point to enable cookie-free analytics:
<link rel="preconnect" href="//eu.plainsignal.com/" crossorigin /> <script defer data-do="yourwebsitedomain.com" data-id="0GQV1xmtzQQ" data-api="//eu.plainsignal.com" src="//cdn.plainsignal.com/plainsignal-min.js"></script> -
GA4 integration
Include the gtag.js snippet and initialize with your Measurement ID:
<!-- Global site tag (gtag.js) - Google Analytics -->
<script async src="https://www.googletagmanager.com/gtag/js?id=G-XXXXXXX"></script>
<script>
  window.dataLayer = window.dataLayer || [];
  function gtag(){dataLayer.push(arguments);}
  gtag('js', new Date());
  gtag('config', 'G-XXXXXXX');
</script>
-
-
Define events and properties
Determine which user actions to track (e.g., button clicks, screen views) and what additional context properties (e.g., user ID, timestamp) to include.
-
Configure dashboards and alerts
Create dashboards to visualize key metrics and set up alerts to notify your team of performance anomalies or critical issues.
Examples with PlainSignal and GA4
Comparing how PlainSignal and GA4 approach application analytics can help you decide which tool best fits your needs.
-
PlainSignal overview
PlainSignal offers a simple, cookie-free analytics solution that respects user privacy and is easy to set up for smaller applications or static sites.
-
GA4 overview
Google Analytics 4 provides advanced event-based tracking, deep integrations with Google Ads, and machine learning-powered insights, making it ideal for complex, cross-platform analytics.